packpop2
This data provides information about population of Mashhad metropolice based on families,owners, tenants, and so on in each block in 2016. There a number of different targets that can be reached through this package such as population density This dataset contains 11 variables and 19943 rows.
Install the package
As a fundamental step, there is a need to install population package if you want to use this data set.
Here is a chunk in order to install the package:
knitr::opts_chunk$set(message = FALSE)
if(!require(remotes)){
    install.packages("remotes")
    library(remotes)
}
remotes::install_github("NiloofarNL/packpop2")
##
checking for file 'C:\Users\bahman.notebook\AppData\Local\Temp\RtmpeI7d2k\remotes2bb4544b59d4\NiloofarNL-packpop2-2e3c417/DESCRIPTION' ...
v checking for file 'C:\Users\bahman.notebook\AppData\Local\Temp\RtmpeI7d2k\remotes2bb4544b59d4\NiloofarNL-packpop2-2e3c417/DESCRIPTION' (465ms)
##
- preparing 'packpop2': (768ms)
## checking DESCRIPTION meta-information ...
checking DESCRIPTION meta-information ...
v checking DESCRIPTION meta-information
##
- checking for LF line-endings in source and make files and shell scripts
##
- checking for empty or unneeded directories
##
- building 'packpop2_0.0.0.9000.tar.gz'
##
## Also a summary of this package can be seen by the chunk below:
##     OBJECTID   Neighbourhoods        Families         Owners
##  Min.   :  1   Length:173         Min.   :    0   Min.   :   0
##  1st Qu.: 44   Class :character   1st Qu.: 2552   1st Qu.:1120
##  Median : 87   Mode  :character   Median : 4620   Median :2096
##  Mean   : 87                      Mean   : 5259   Mean   :2342
##  3rd Qu.:130                      3rd Qu.: 7034   3rd Qu.:3020
##  Max.   :173                      Max.   :20359   Max.   :8314
##                                   NA's   :1       NA's   :1
##     Tenants      Total Residential Units Apartment Units  House Units
##  Min.   :    0   Min.   :    0           Min.   :    0   Min.   :    0
##  1st Qu.: 1162   1st Qu.: 2478           1st Qu.: 1002   1st Qu.:  758
##  Median : 2174   Median : 4540           Median : 2391   Median : 1428
##  Mean   : 2456   Mean   : 5122           Mean   : 3079   Mean   : 2043
##  3rd Qu.: 3258   3rd Qu.: 6812           3rd Qu.: 4583   3rd Qu.: 2595
##  Max.   :10708   Max.   :19815           Max.   :12164   Max.   :13236
##  NA's   :1       NA's   :1               NA's   :1       NA's   :1
##  Cottages or Sheds  Shape_Length     Shape_Area       Area(Hectare)
##  Min.   : 0.000    Min.   : 1899   Min.   :  190576   Min.   :  19.0
##  1st Qu.: 0.000    1st Qu.: 4290   1st Qu.:  876015   1st Qu.:  88.0
##  Median : 1.000    Median : 5364   Median : 1368233   Median : 137.0
##  Mean   : 1.773    Mean   : 5857   Mean   : 1762437   Mean   : 176.3
##  3rd Qu.: 2.000    3rd Qu.: 6925   3rd Qu.: 2067674   3rd Qu.: 207.0
##  Max.   :48.000    Max.   :20888   Max.   :16678412   Max.   :1668.0
##  NA's   :1
##  PopulationDensity   Population
##  Min.   :  0.00    Min.   :    0
##  1st Qu.: 76.75    1st Qu.: 8415
##  Median :131.00    Median :15387
##  Mean   :131.25    Mean   :17141
##  3rd Qu.:175.00    3rd Qu.:23460
##  Max.   :367.00    Max.   :71466
##  NA's   :1
Following this, there is a list of libraries in this data set:
As mentioned before, this data set has 14 variables
| OBJECTID | Id of each block as a factor |
| Neighbourhoods | The names of Mashhad’s neighbourhoods |
| Families | Number of families living in a block |
| Owners | Number of people who has their own property in a block |
| Tenants | Number of people who rent a property in a block |
| Total Residential Units | Whole number of residential suits in a block |
| Apartment Units | Number of suits in apartments in a block |
| House Units | Number of village houses in a block |
| Cottages or Sheds | Number of sheds in a block |
| Shape_Length | Surrounding a block in meter scale |
| Shape_Area | Surface area of a block in meter scale |
| Area(Hectare) | Surface area of a neighbourhoods in hectare scale |
| PopulationDensity | Population density of each neighbourhood |
| Population | Whole population of each neighbourhood |
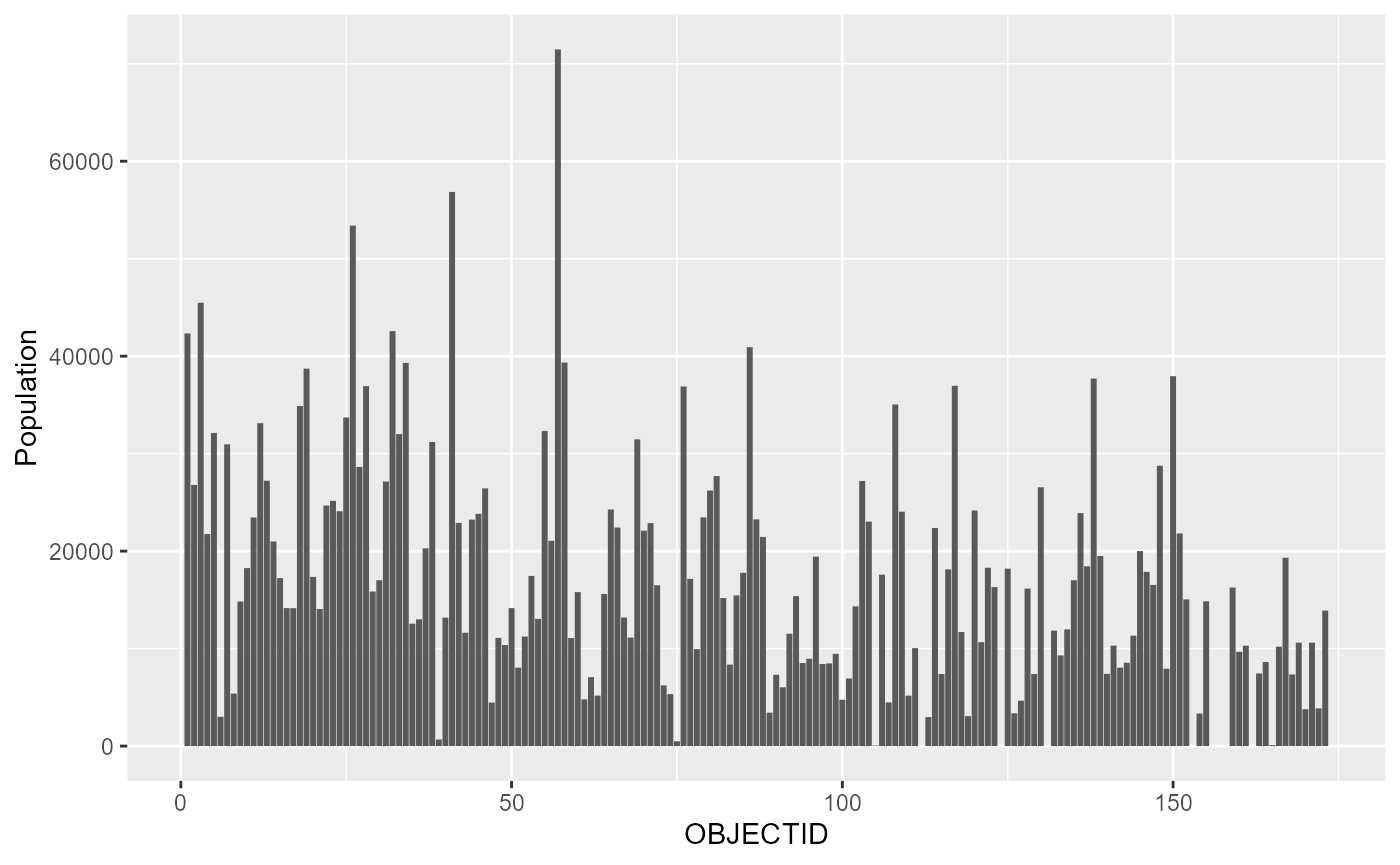
Also we can see the bar chart of population in each block
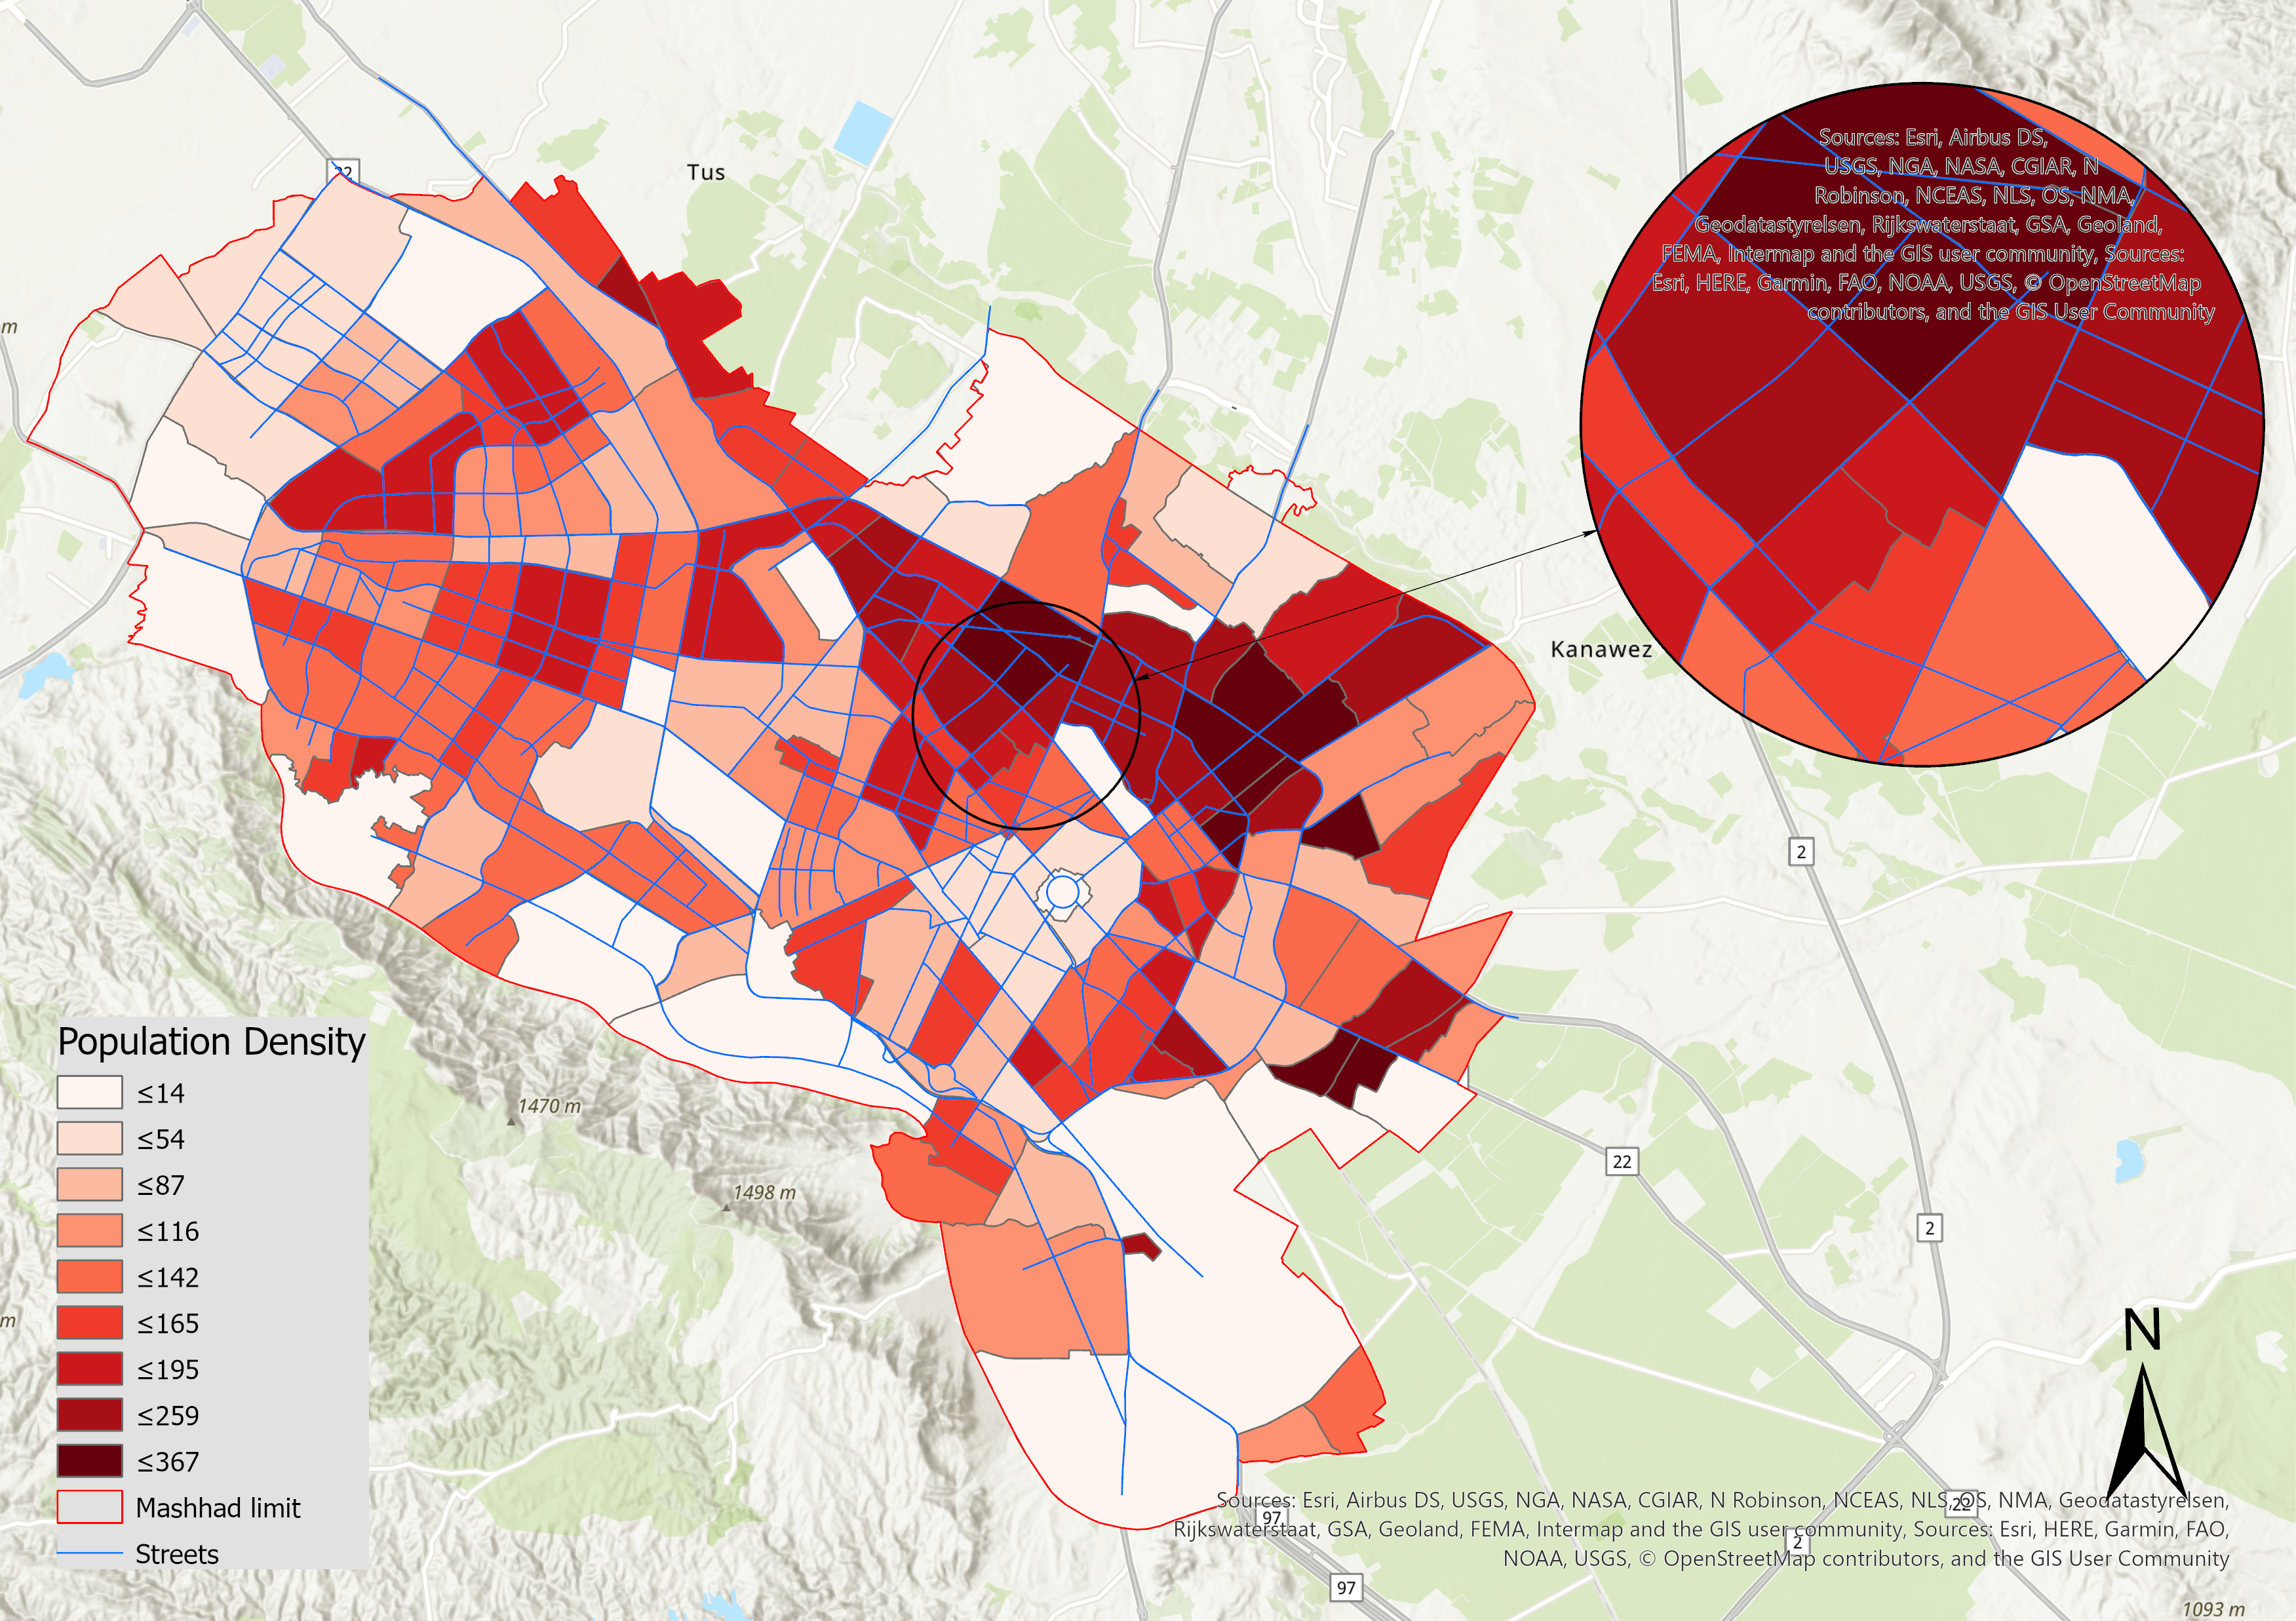
Population Density in Mashhad 2016
Here is another map
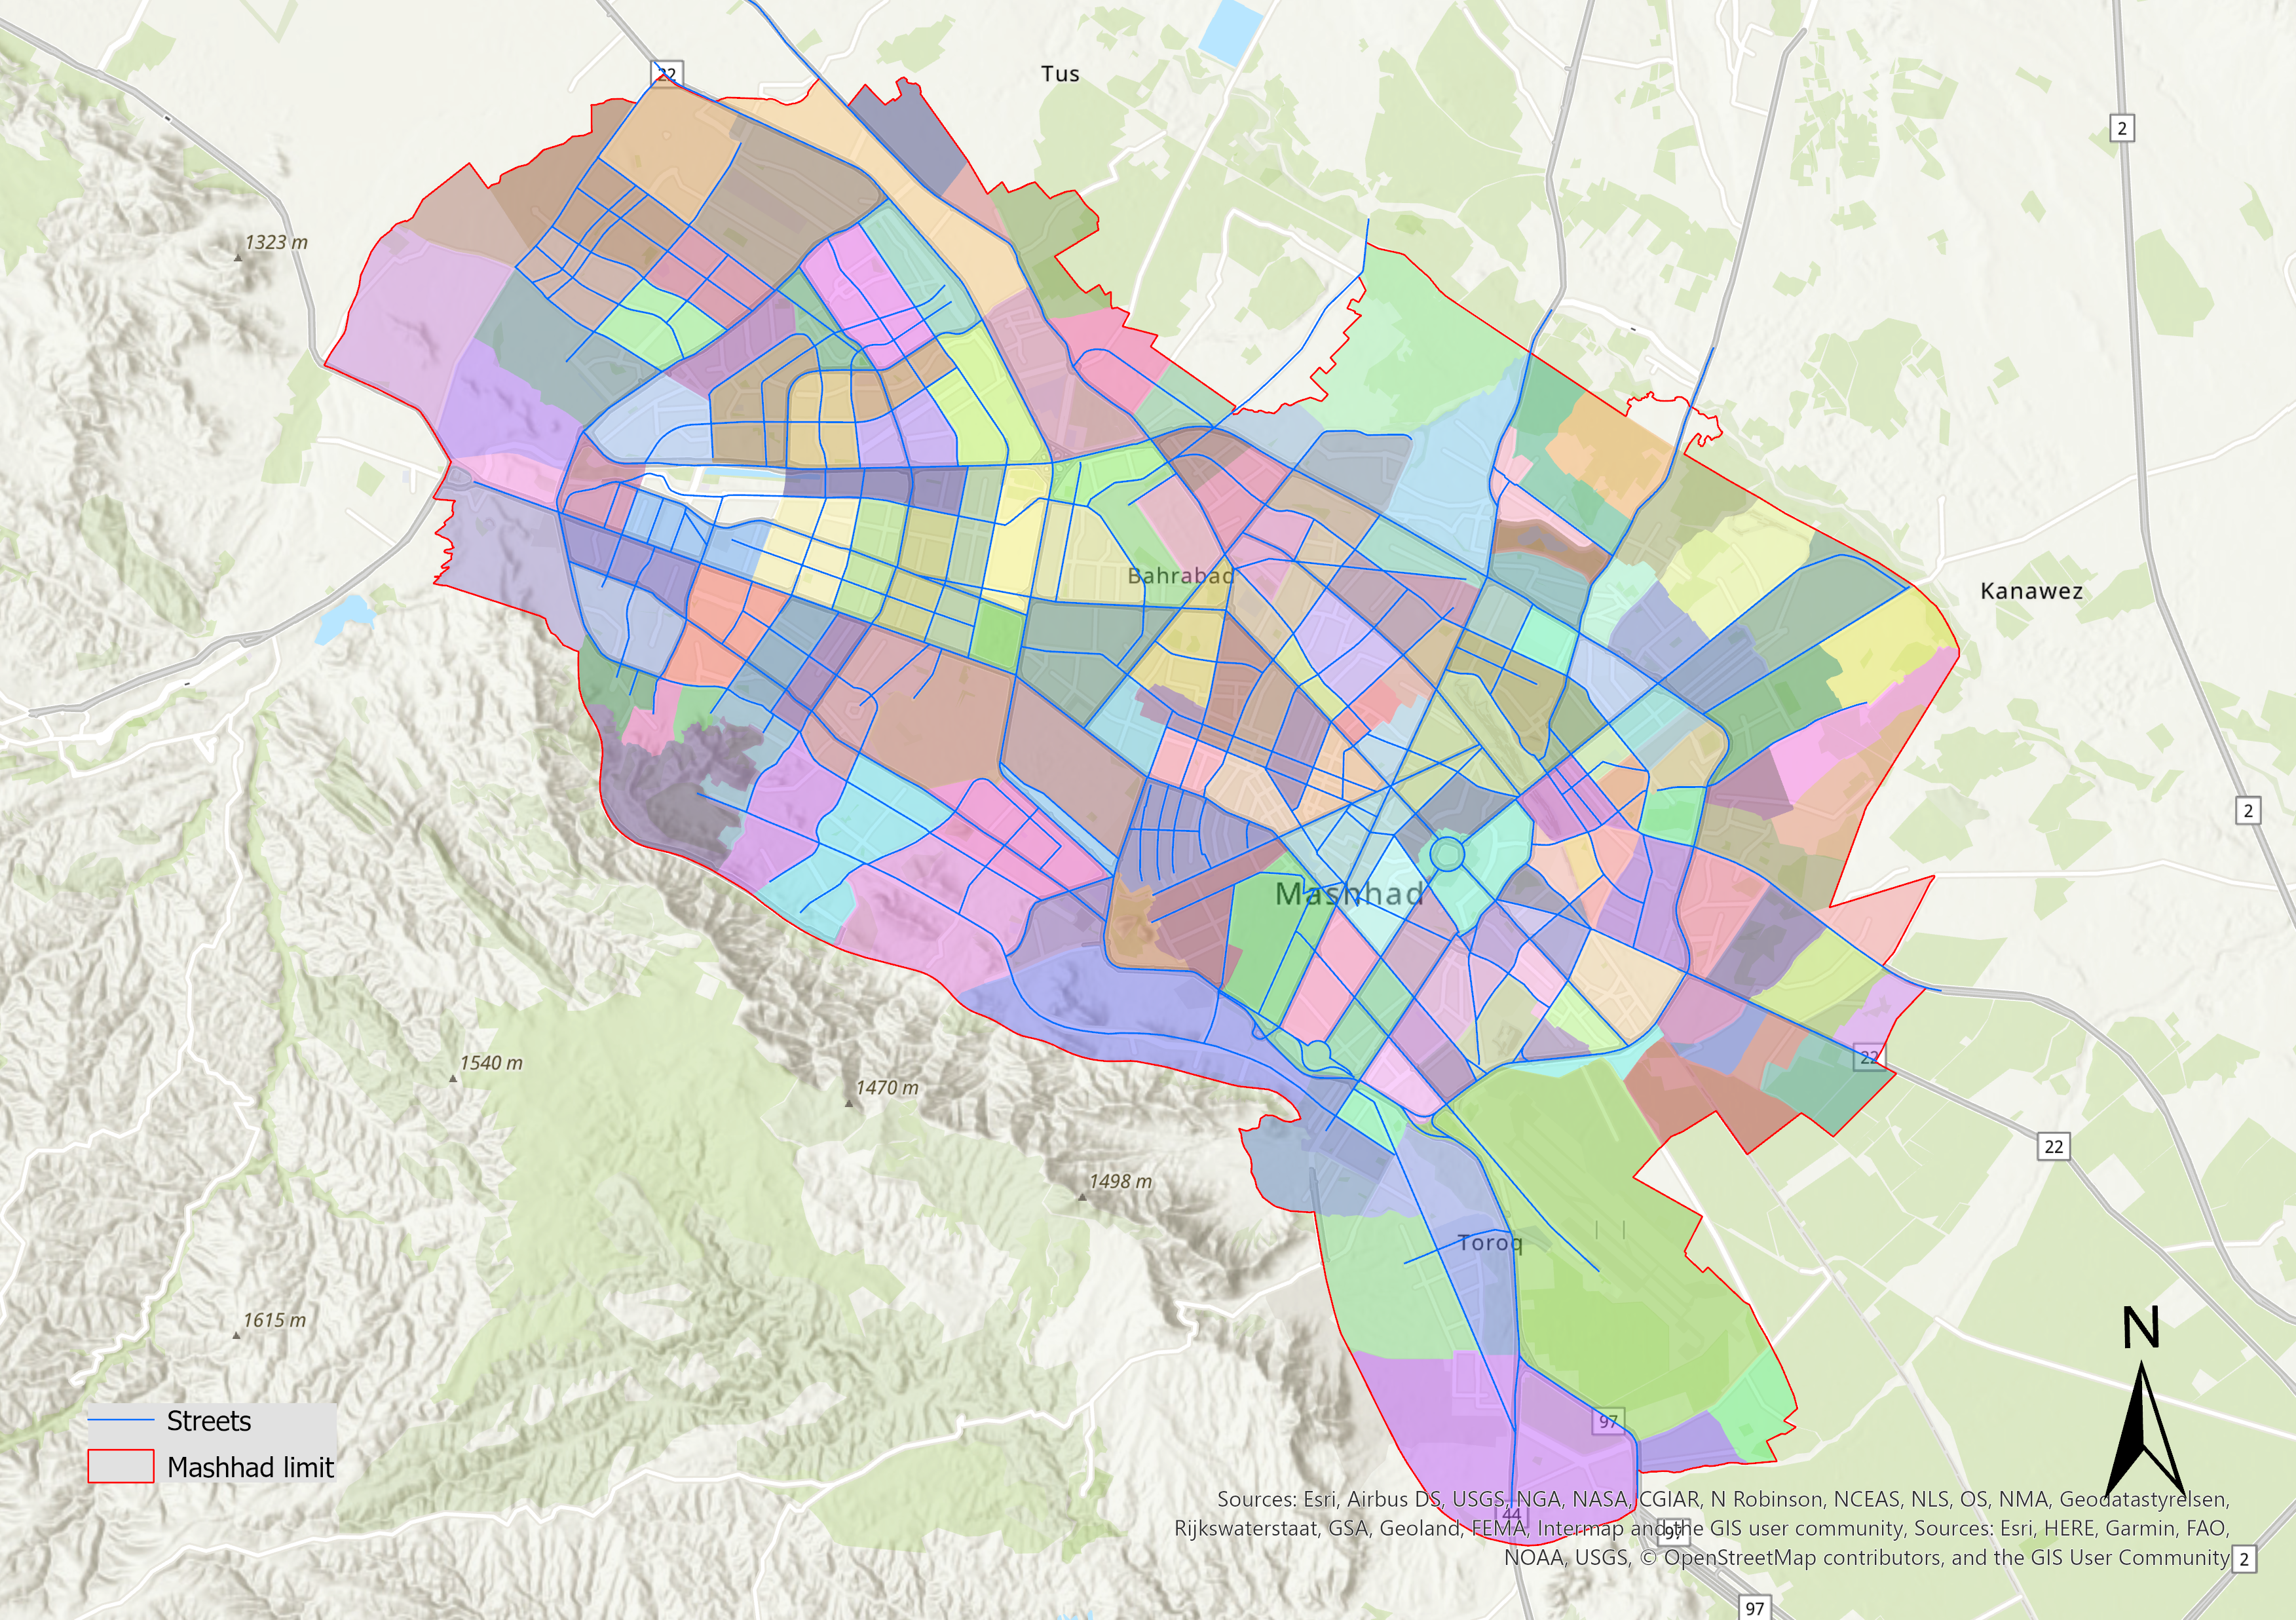
Mashhad’s Neighbourhoods in 2016
Assuming that population density (r) at distance r from the city center declines monotonically, (Chen 2008)reintroduce an empirical model that can be written as
\[\begin{equation} \label{eq:1} \rho(r) = \rho_0 exp (-br) = \rho_0 exp (-\frac{r}{r_0}) \end{equation}\]Where \(\rho_0\) is a constant of propotionality which is supposed to equal the central density, that is, \(\rho\_0 = \rho(0)\), \(b\) denotes a rate at which the effect of distance attenuates, and \(r_0 = 1/b\) refers to a characteristic radius of urban population distribution.